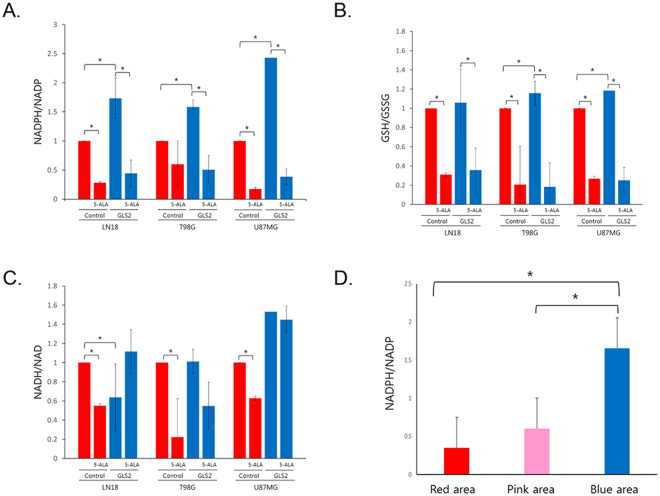
Figure 4.
(A–C) Metabolite screening by using liquid chromatography-mass spectrometry (LC-MS) on glioblastoma cell lines with or without GLS2 expression after 5-aminolevulinic acid (5-ALA) treatment. Each sample was tested in triplicate. NADPH/NADP levels were significantly increased with GLS2 expression, but they decreased rapidly after 5-ALA treatment in all cell lines (A). GSH/GSSG levels were also decreased after 5-ALA treatment, but they increased with GLS2 expression in 2 cell lines with a relatively small amount of change (B). NADH/NAD levels were decreased after 5-ALA treatment only in cells without GLS2 expression (C). (D) Direct measurement of NADPH/NADP levels in glioblastoma tissues showing different fluorescence intensities (n = 30) confirmed increased NADPH/NADP levels in the no-tumor area without fluorescence.

