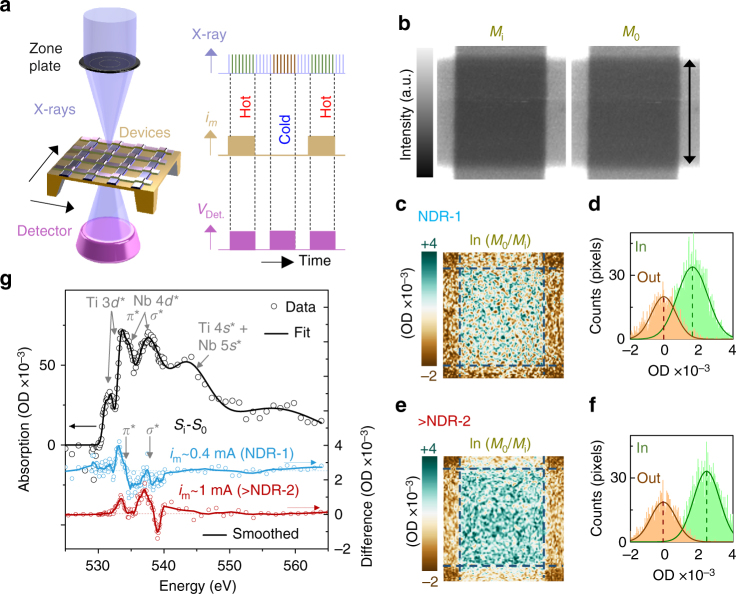
Fig. 3.
In operando synchrotron X-ray spectromicroscopy. a Schematic of the experimental setup. Synchronous operational pulse signals to the detector and the devices are shown, along with the incoming asynchronous X-ray pulses. b X-ray transmission maps of the crosspoint area of a fresh device identical to the one used in Fig. 2, with current (~0.4 mA, sufficient to cause NDR-1) (M i) and with no current (M 0) obtained using 533.2 eV X-rays. Scale bar is 2 µm. c Logarithmic ratio of the maps in b. Intensity in optical density, OD. d Histograms of the data inside and outside the crosspoint area in c. e Logarithmic ratio of maps similar to those in (b) obtained with a current sufficient to exceed NDR-2 (~1 mA) and, (f) its corresponding histograms, similar to those in (d). g X-ray absorption spectra of the material within the crosspoint, along with the component bands marked. The spectral differences between the material with current and that with no current are also shown for two different currents, as marked (arbitrarily offset, horizontal dashed lines indicate zero difference for respective colors)

