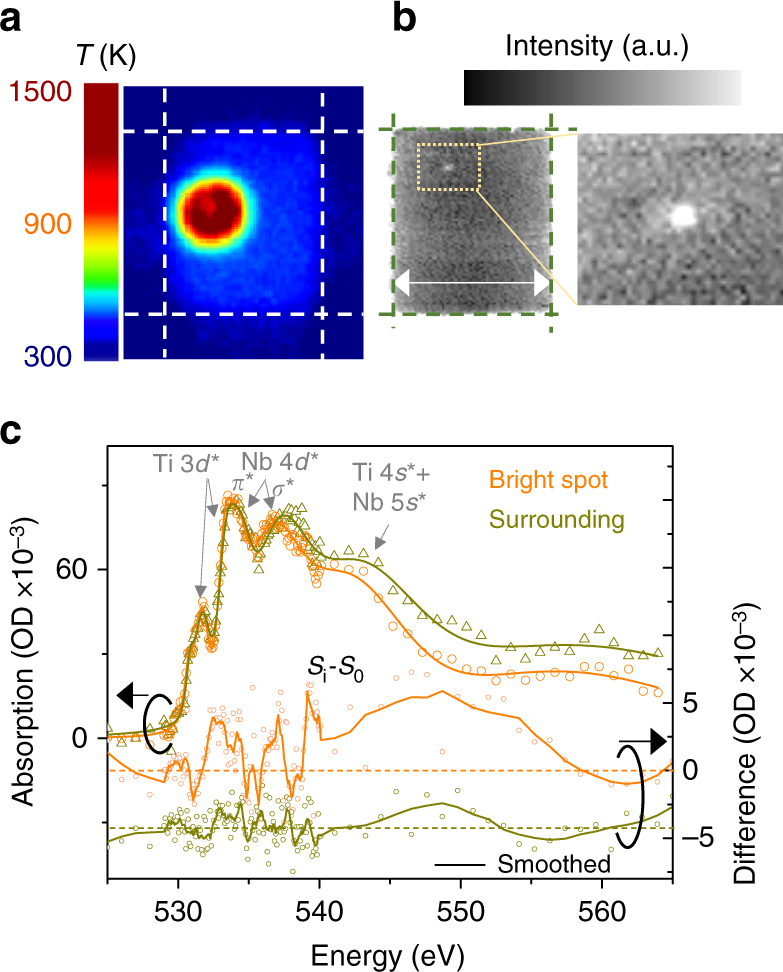
Fig. 4.

Operation with a voltage source. a Temperature map of a fresh crosspoint device identical to the ones explained previously held at an applied voltage of 1 V with R S < R NDR). b X-ray transmission maps of a fresh crosspoint device identical to the one used in (a) that was previously subject to an applied voltage of 1 V (no bias was applied during acquisition of this data). Scale bar is 2 µm. A localized bright spot is shown in a magnified map. c X-ray absorption spectra of the “bright spot” and its “surrounding” region, color-coded to the legend. The spectral differences between the material with current and that with no current (S i–S 0) are also shown for the two different regions (arbitrarily offset, horizontal dashed lines indicate zero difference for respective colors)
