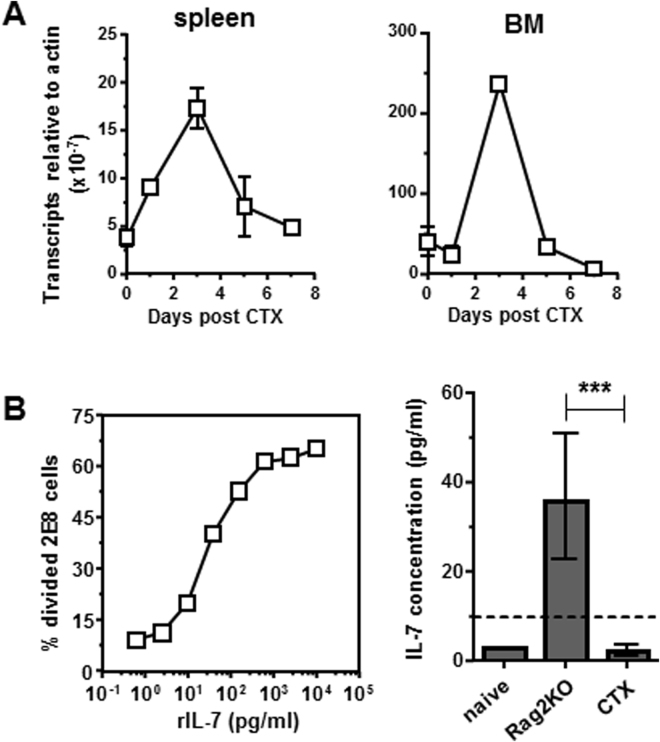
Figure 2.
Quantification of the endogenous IL-7 in mice after CTX treatment. (A) IL-7 RNA levels in mouse spleen and bone marrow (BM) after CTX treatment. At the indicated time points after CTX treatment, spleen and BM samples were harvested, and total RNA was extracted. IL-7 transcripts in spleen and BM was quantified by real-time RT-PCR. Data represent the relative amount of IL-7 mRNA normalized to β-actin shown as mean ± SD of triplicates of each sample. Data shown are results of one out three independent experiments with similar results. (B) Quantification of IL-7 levels in mouse serum using 2E8 cell-based bioassay. Serum samples were collected from Rag2KO, untreated naïve mice, and CTX-treated mice. CFSE-labeled IL-7-responsive 2E8 cells were seeded in a 96-well plate in the presence of serum samples or serially diluted rmIL-7 as the standards. After 3 days in culture, cell proliferation was evaluated by CFSE dilution using flow cytometry. The graph on the left shows the standard curve, which is generated by plotting the percent of divided 2E8 cells against the concentration of rmIL-7. The bar graph on the right shows IL-7 concentrations in serum samples calculated based on the regression equation derived from the standard curve. The dash line indicates the concentration of rmIL-7 needed in culture in order to drive 2E8 cell proliferation that is significantly above the background level. Data shown are pooled from 2 independent experiments with at least lest 3 mice in each group. ***P < 0.001.

