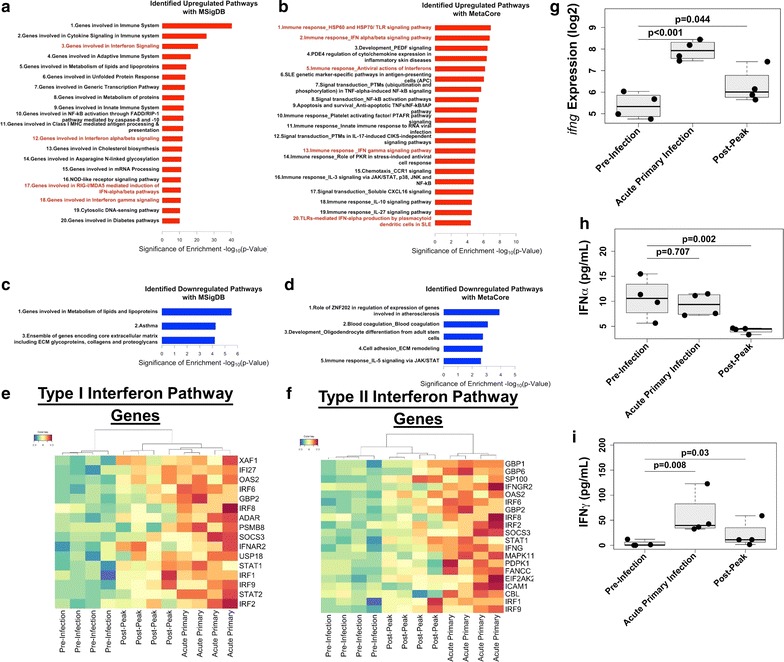
Fig. 3.

Type I and Type II interferon transcriptional signatures are enriched in the bone marrow during acute malaria. a Pathways enriched with upregulated genes using GSEA. Pathways associated with interferons are highlighted in red. Bars indicate the negative logarithm base 10 of the p value of the enrichment for a given gene set. b Pathways enriched with upregulated genes using MetaCore. Pathways associated with interferons are highlighted in red. c Pathways enriched with downregulated genes using GSEA. d Pathways enriched with downregulated genes using MetaCore. e Clustered heatmap of transcriptional profiles of Type I IFN signature genes. Colours indicate z-score normalized expression values. f Clustered heatmap of transcriptional profiles of Type II IFN signature genes. g ifnγ BM expression levels. h IFNα serum concentrations. i IFNγ serum concentrations
