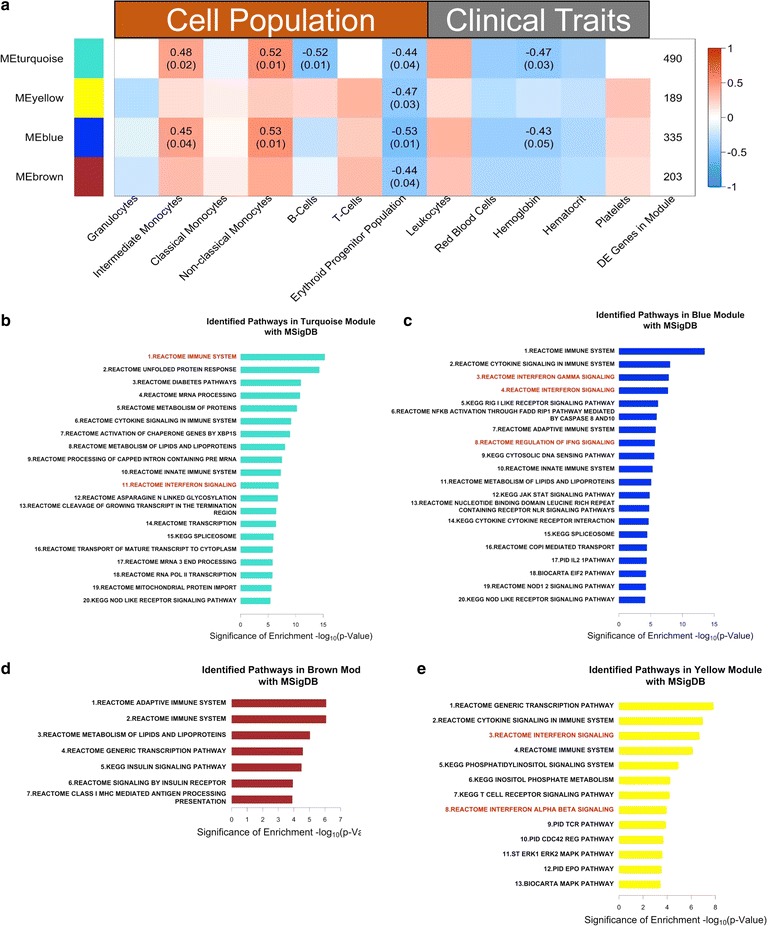
Fig. 4.

Intermediate and non-classical monocytes in the bone marrow are correlated with gene modules that may negatively impact the erythroid lineage. a Correlation of gene modules with cell population measurements and clinical traits based on WGNCA analysis of the BM transcriptome. Rows contain different transcriptional modules identified by WGCNA, with the colour in a given column indicating the degree of correlation of that module with cell population or clinical trait measurements. The top number in each entry is the Spearman correlation coefficient for any correlation with p < 0.05, and the bottom number is the p value significance of the correlation coefficient. The last column indicates the number of genes in each module. b–e Significantly enriched pathways in the turquoise, blue, brown, and yellow modules based on analysis using MSigDB. Bars indicate the negative logarithm base 10 of the p value of the enrichment for a given gene set
