
Fig. 6.
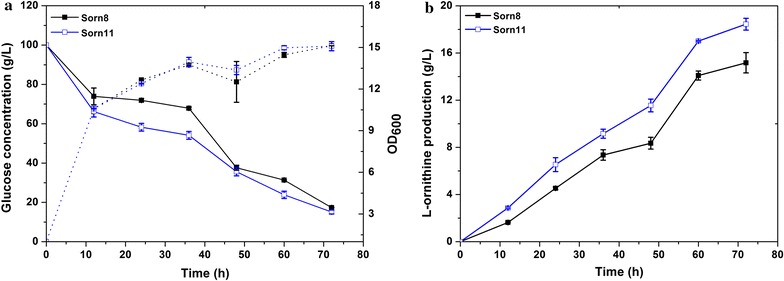
Effect of lysE overexpression on l-ornithine production. a The glucose concentration and growth curve of Sorn8 and Sorn11. The solid line represents the glucose concentration curve; the dotted line represents growth curve. b l-Ornithine production curves of Sorn8 and Sorn11. Results of standard deviations present in three individual experiments