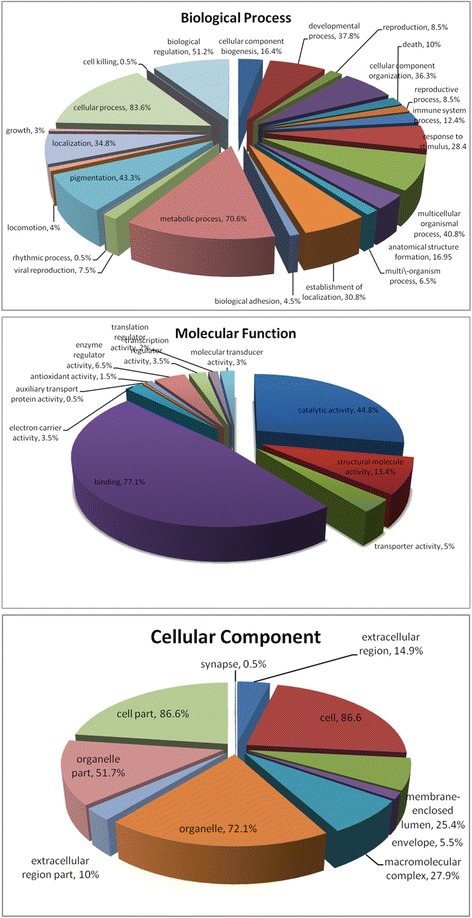
Fig. 3.

GO distribution analysis of differentially expressed proteins during regeneration from the control and treatment groups (3, 7, 14, 30 and 42dpa). In total, 200 differentially expressed proteins were categorized based on “Cellular Component”, “Molecular Function”, and “Biological Process” using WEGO
