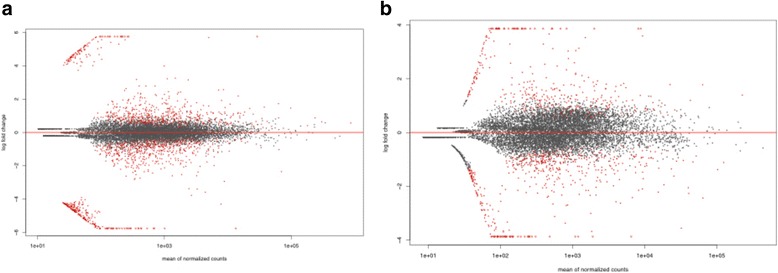
Fig. 1.

Plots of LogFC (Fold Change) against The Mean of Normalized Counts among the antennae (a) and maxillary palps (b) between An. coluzzi and An. quadriannulatus. Each dot represent a measure of abundance, with red colored dots indicating statistically significant differences in expression. logFC values above zero are those that are upregulated in An. coluzzii where as those below zero are upregulated in An. quadriannulatus
