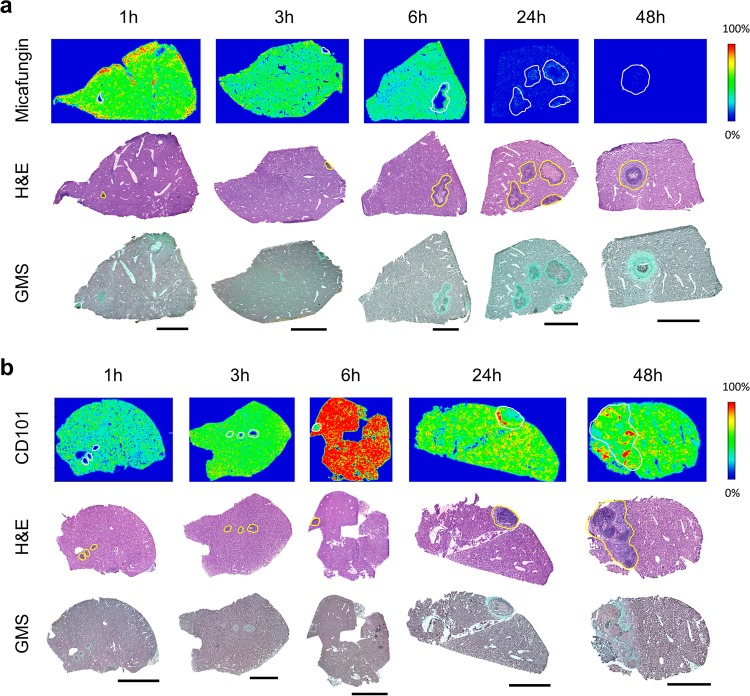
FIG 2.
Drug distribution in infected liver tissues after single doses of micafungin and CD101. (a, upper) Ion maps of micafungin in representative liver tissues collected at 1, 3, 6, 24, and 48 h after a single dose of micafungin at 5 mg/kg. The signal intensity color bar is fixed for micafungin, with gradually increased intensity from blue (no signal) to red (max signal). H&E and GMS staining of adjacent sections are shown below each set of ion maps. Outlines highlight the lesion area on each tissue section. Scale bars, 3 mm. (b, upper) Ion maps of CD101 in representative liver tissues collected at 1, 3, 6, 24, and 48 h after a single dose of CD101 at 20 mg/kg. The signal intensity color bar is fixed for CD101, with gradually increased intensity from blue (no signal) to red (maximum signal). Matched H&E and GMS staining results are shown in the middle and bottom rows, respectively. Scale bars, 3 mm.

