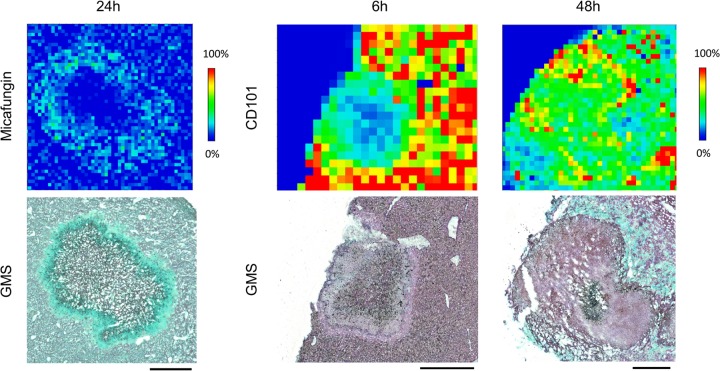
FIG 3.
Close-up examination of drug penetration for micafungin at 24 h and CD101 at 6 and 48 h after single dosing. An enlarged view of drug distribution in a single lesion at pixel level is shown. Matched GMS staining of adjacent sections was placed on the bottom. Signal intensity is fixed for CD101 and micafungin. Scale bars, 5 mm.

