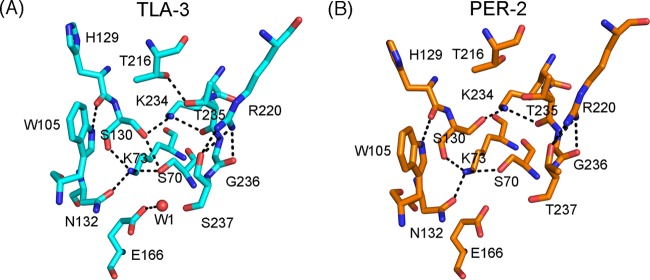
FIG 4.
Schematic representation of the active sites of TLA-3 (A) and PER-2 (PDB accession no. 4D2O) (B). Cyan and orange sticks, carbon atoms of TLA-3 and PER-2, respectively; red and blue sticks, oxygen and nitrogen atoms, respectively; black dashed lines, hydrogen bonds (cutoff distance, 3.2 Å); red sphere, the water molecule (W1). Images were rendered using the PyMOL program.

