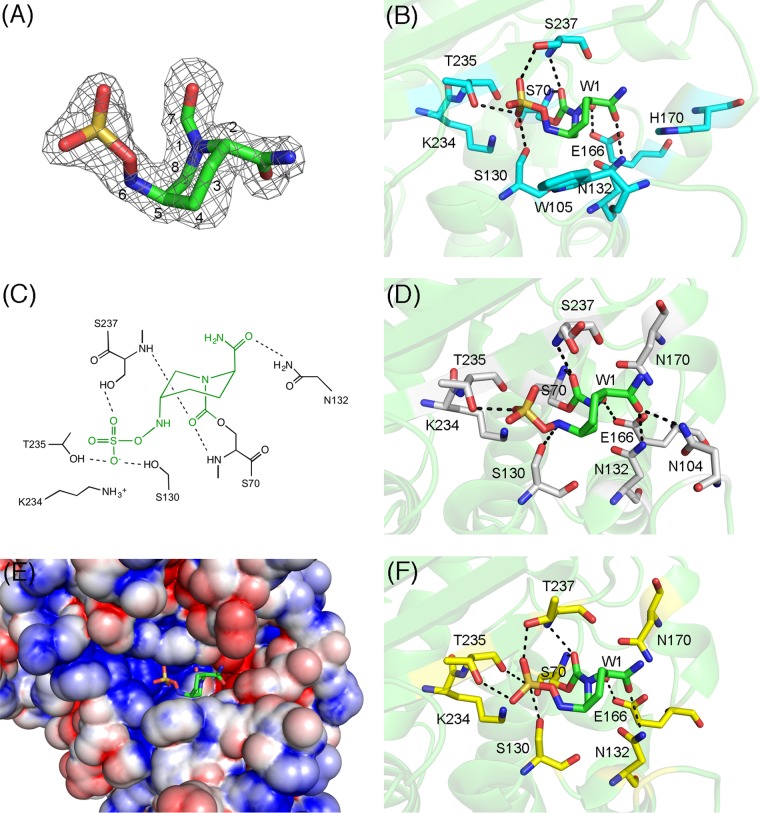
FIG 5.
(A) |Fobs|−|Fcalc| omit map of avibactam, contoured at 3.0σ (gray mesh). Avibactam is illustrated using green (carbon), ocher (sulfur), red (oxygen), and blue (nitrogen) sticks. (B) Interactions between TLA-3 and avibactam. Amino acids are drawn as cyan (carbon), red (oxygen), and blue (nitrogen) sticks, and avibactam is shown as described in the legend to panel A. Red sphere, the water molecule (W1); black dashed lines, hydrogen bonds (cutoff distance, 3.2 Å). (C) Two-dimensional view of the binding between TLA-3 and avibactam. Green, avibactam; black, amino acids; dashed lines, hydrogen bonds (cutoff distance, 3.2 Å). The figure was rendered using ChemBioDraw (version 13.0) software. (D) Interactions between CTX-M-15 and avibactam (PDB accession no. 4HBU). Amino acids are drawn as gray (carbon), red (oxygen), and blue (nitrogen) sticks, and avibactam is shown as described in the legend to panel A. Red sphere, the water molecule (W1); black dashed lines, hydrogen bonds (cutoff distance, 3.2 Å). (E) Molecular surface representation of TLA-3, colored according to electrostatic charge (red, negative; blue, positive). Avibactam is shown in stick form as described in the legend to panel A. (F) Interactions between KPC-2 and avibactam (PDB accession no. 4ZBE). Amino acids are drawn as yellow (carbon), red (oxygen), and blue (nitrogen) sticks, and avibactam is shown as described in the legend to panel A. Red sphere, the water molecule (W1); black dashed lines, hydrogen bonds (cutoff distance, 3.2 Å).

