
FIG 6.
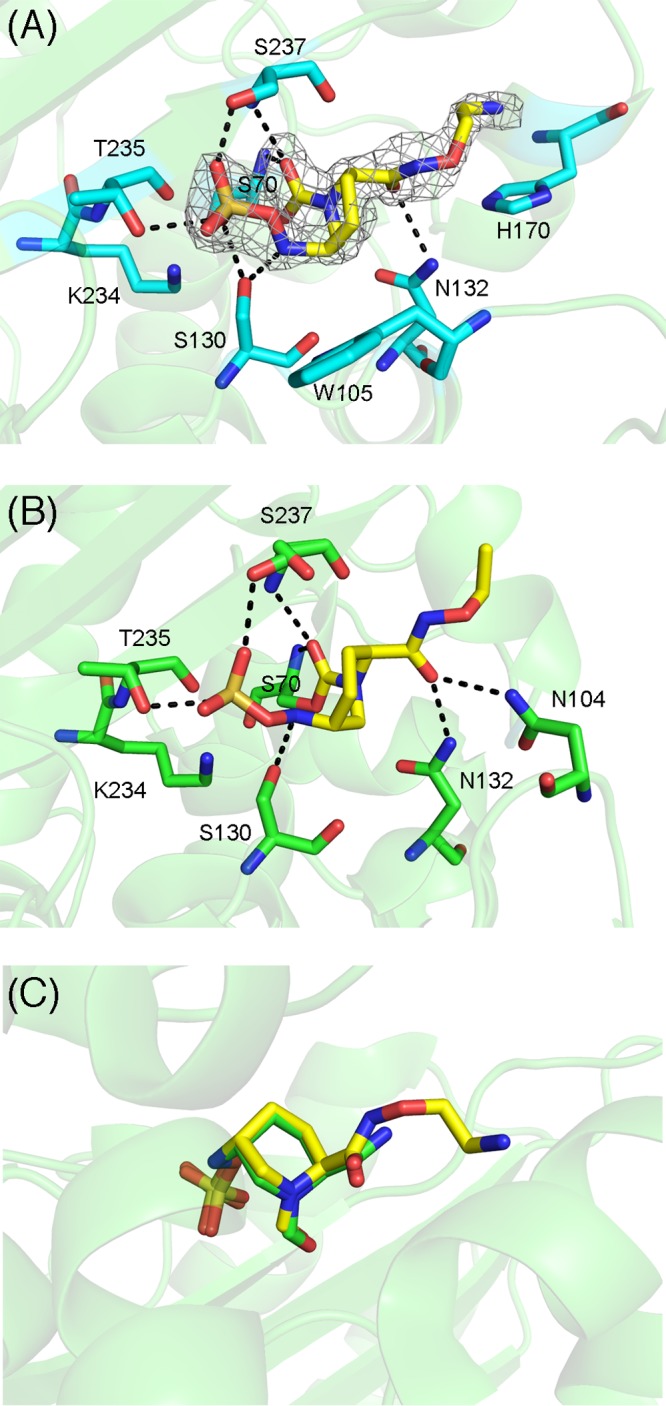
(A) Interactions between TLA-3 and OP0595. Amino acids are drawn as cyan (carbon), red (oxygen), and blue (nitrogen) sticks, whereas OP0595 is depicted by yellow sticks. Black dashed lines, hydrogen bonds (cutoff distance, 3.2 Å). The figure shows the |Fobs|−|Fcalc| omit map of OP0595, contoured at 2.5σ (gray mesh). (B) Interactions between Toho-1 (CTX-M-44) and OP0595 (PDB accession no. 4X69). Amino acids are drawn as green (carbon), red (oxygen), and blue (nitrogen) sticks, whereas OP0595 is depicted by yellow sticks. Black dashed lines, hydrogen bonds (cutoff distance, 3.2 Å). (C) Superposition of avibactam and OP0595 in TLA-3. Avibactam and OP0595 are represented by green and yellow sticks, respectively. Images were rendered using the PyMOL program.