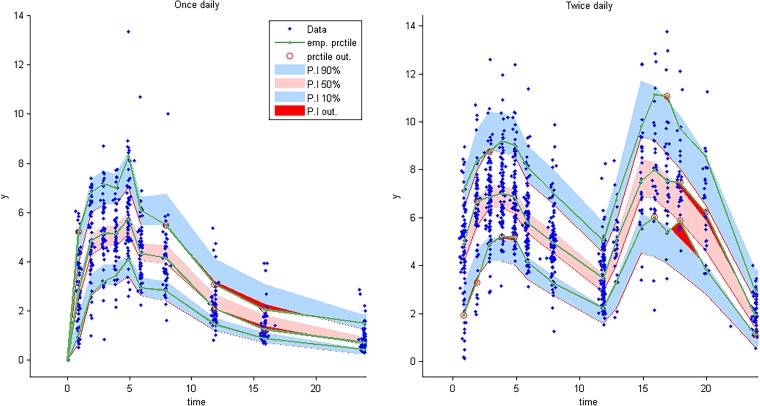
FIG 4.
Visual predictive check for AZD-5847 concentration versus time based on 1,000 Monte Carlo simulations. The solid green line represents the 10th, 50th, and 90th percentiles of observed data. The shaded regions represent the 90% confidence interval around the 10th, 50th, and 90th percentiles of simulated data. The blue diamonds are observed concentrations.

