
Fig. 1.
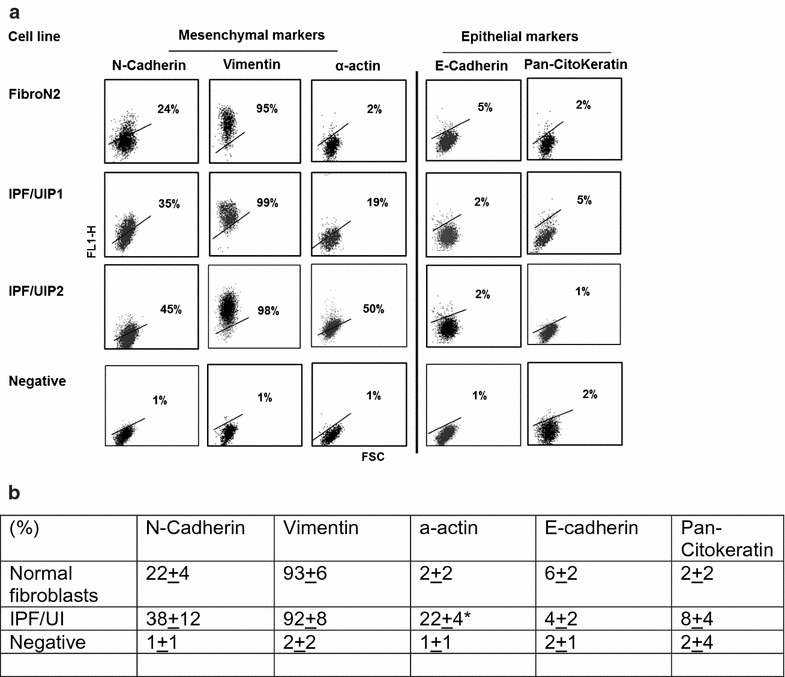
Analysis of mesenchymal and epithelial markers in representative idiopathic pulmonary fibrosis (IPF/UIP1 and 2) and normal fibroblast (FibroN2) cell cultures using flow cytometry. a Analysis of mesenchymal and epithelial markers in representative idiopathic pulmonary fibrosis (IPF/UIP1 and 2) and normal fibroblast (FibroN2) cell cultures using flow cytometry. b Panel B represents the mean values ± SD of the results obtained in the two normal fibroblast cell cultures considered as controls in comparison with the five fibroblast cell cultures obtained from IPF patients. * p < 0.01 versus normal fibroblast cell cultures. Negative sample was generated with the corresponding isotope (negative)