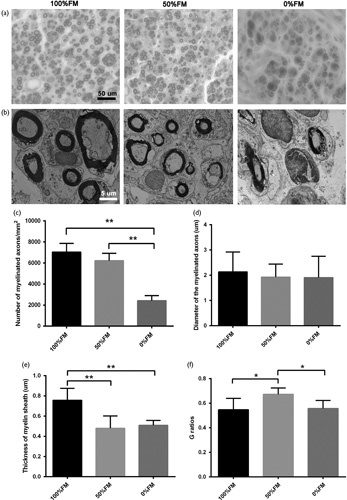
Fig. 5.

Transverse sections of the middle part of the regenerated nerve at 6 weeks postoperatively. (a) Toluidine blue staining. (b) Transmission electron micrograph (TEM) images of regeneration axons. (c) The number of myelinated axons in each area (mm2). The 100%FM and 50%FM groups appeared to have more regenerating nerve fibres than the 0%FM group. (d) The diameter of the myelinated axons from TEM evaluation. (e) Thickness of the myelin sheath. (f) G-ratios of the myelinated nerve fibres. Error bars correspond to the mean±SD (n=6). *P<0.05, **P<0.01. Scale bar=50 and 5 µm, respectively. FM, fascicle matching.
