Fig. 4.

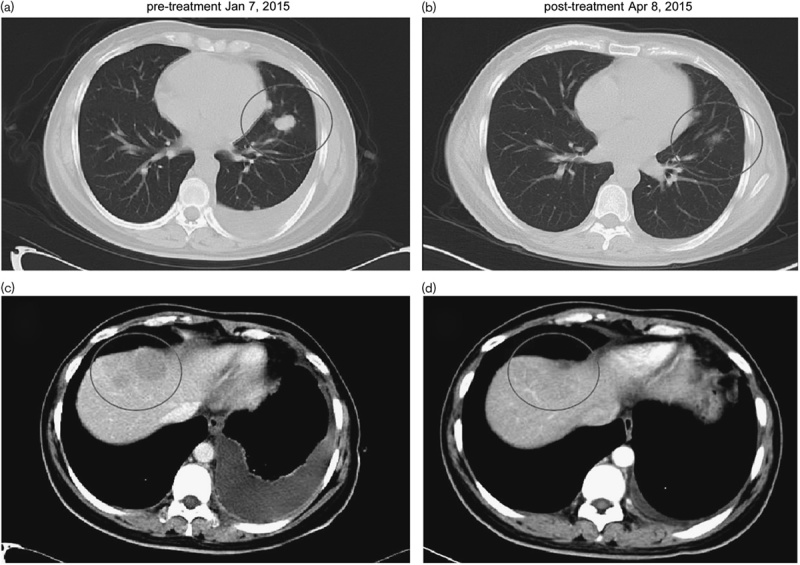
A chest computed tomographic scan after 2 months of gefitnib treatment showing that the tumor in the left lobe and the liver had shrunk (b, d) compared with before gefitinib treatment (a, c). The circles represent the location of the tumor.

A chest computed tomographic scan after 2 months of gefitnib treatment showing that the tumor in the left lobe and the liver had shrunk (b, d) compared with before gefitinib treatment (a, c). The circles represent the location of the tumor.