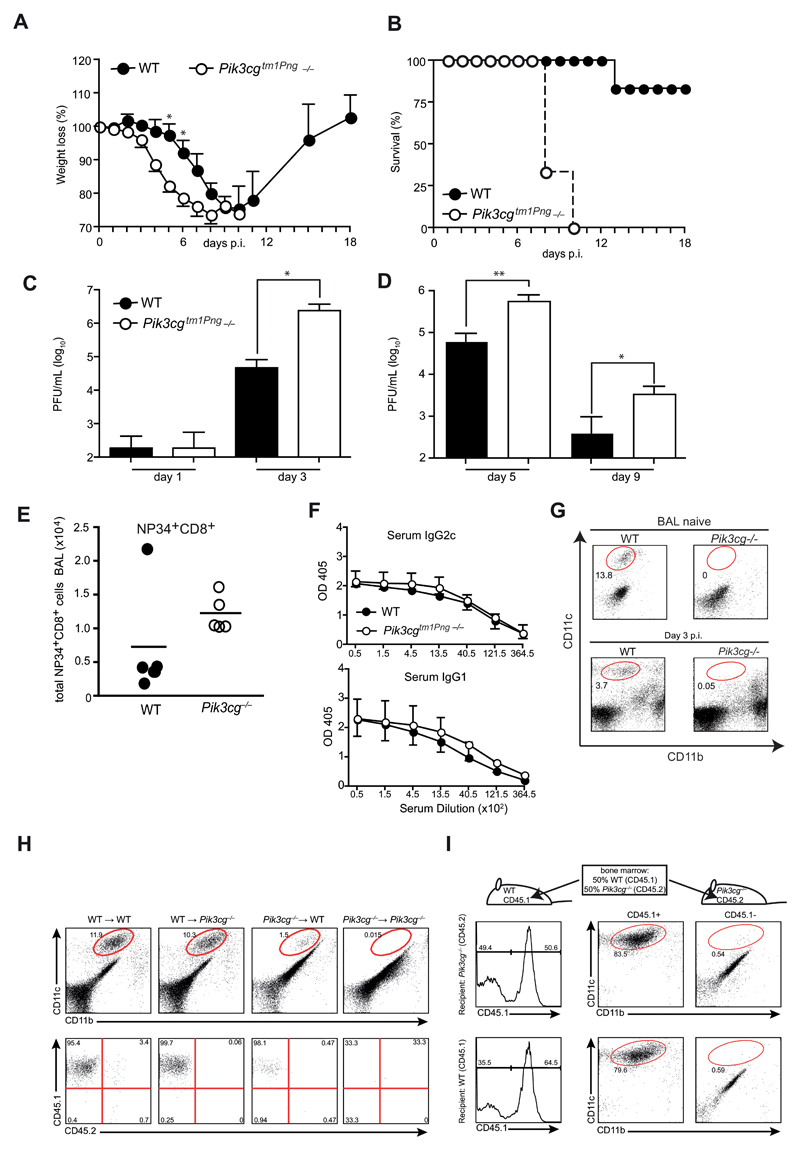
Figure 1. Pik3cg–/– mice are hypersusceptible to influenza virus infection.
(A and B) Pik3cgtm1Pen deficient and WT control mice were infected i.t. with 50 PFU influenza A virus PR8 and their survival (A) and weight loss (B) was monitored. (C and D) Lung viral titers were determined by plaque-assay in MDCK cells. (E and F) BAL cells from mice at day 9 p.i. were analyzed by FACS. Plots show numbers of (E) NP34-specific (left panel) and total CD8+ T cells (right panel). (F) Serum from mice at day 9 p.i. was assessed for virus-specific IgG2c and IgG1 by ELISA. (G) AM in the BAL were quantified in naïve and infected mice at d3 using flow cytometry. (H) Crisscross chimeras were generated by transfer of bone marrow (BM) from either WT or Pik3cgtm1Pen mice to lethally irradiated WT and KO recipients. FACS plots in the upper panel show CD11c and CD11b expression of BAL cells from naïve chimeric mice with gated cells indicating AM. Lower panels depict AM derived from WT (CD45.1+) versus Pik3cgtm1Pen (CD45.2) expression of gated cells. (I) Irradiated WT and Pik3cgtm1Pen recipients were reconstituted with a mixture of WT and Pik3cgtm1Pen BM in a 50:50 ratio. BAL cells from naïve mixed chimeric were analyzed by FACS. Histograms show gating strategy for CD45.1 (WT) expression, FACS plots on the right side illustrate CD11c versus CD11b expression of CD45.1-gated cells. N= 3-5 per group. All experiments have been performed at least twice.

