
Figure 2.
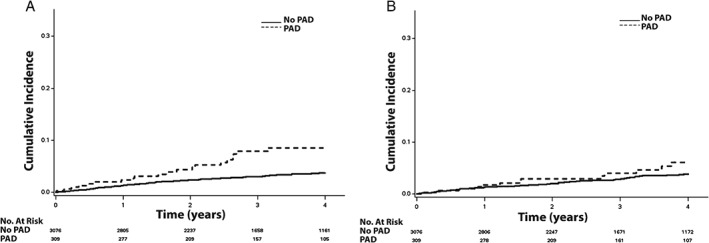
The cumulative incidence curves for (A) MI and (B) stroke. The cumulative incidence curves are statistically different for both MI (log‐rank P < 0.001) and stroke (log‐rank P = 0.046). Abbreviations: MI, myocardial infarction; PAD, peripheral artery disease.