Figure 2.
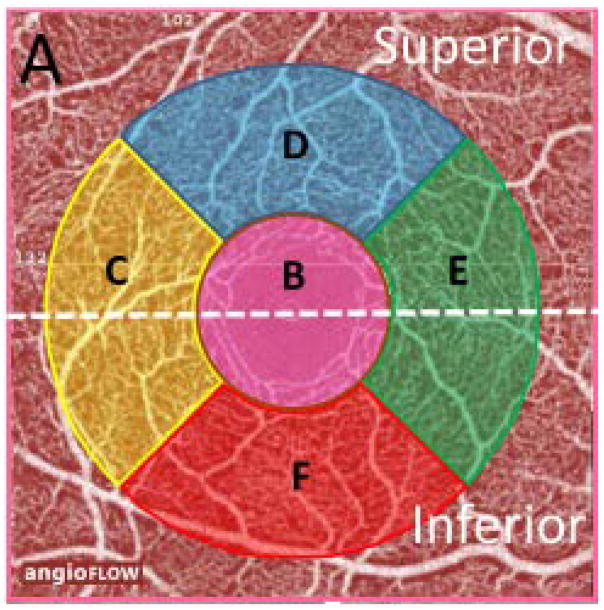
Longitudinal changes in optical coherence tomography angiography images of the superficial retinal vascular plexus (3.0 mm × 3.0 mm scan size) in a healthy and in a glaucomatous eye. Top and fifth row: fundus photograph (left) and vessel density map, seen over time in healthy subject using optical coherence tomography (OCT) -angiography(A). Second and sixth row: standard automated perimetry (SAP) results (left) and area density color-coded map in a healthy subject (2nd row) and glaucoma patients (6th row). OCT-A macula scan showing the superficial vascular plexus; corresponding color-coded flow density map of the superficial vascular plexus flow density (the warmer the color, the greater the flow). This healthy case shows vessel density was almost unchanged (56.23% to 57.38%) over time. In contrast, vessel density was decreased 50.06% to 44.38% overtime, regardless of SSI in glaucoma patients. Third and seventh row: ganglion cell complex (GCC) map over time. The measurement parameters from GCC thickness of analysis are automatically compared to the OCT’s normative limits, and the results are color-coded for “within normal limits” (green), “borderline” (yellow), and “outside normal limits” (red). The average GCC thickness was also almost unchanged over time both healthy subjects (104.7μm to 105.5μm) and glaucoma patients (59.4μm to 60.5μm). Fourth and bottom row: optic nerve head (ONH) thickness color-coded map (the warmer the color, the greater the thickness) and results of sector analysis automatically compared to the OCT’s normative limits, color-coded for “within normal limits” (green), “borderline” (yellow), and “outside normal limits” (red) at outer ring. The average cpRNFL thickness was also almost unchanged over time in both cases.

