
Figure 1.
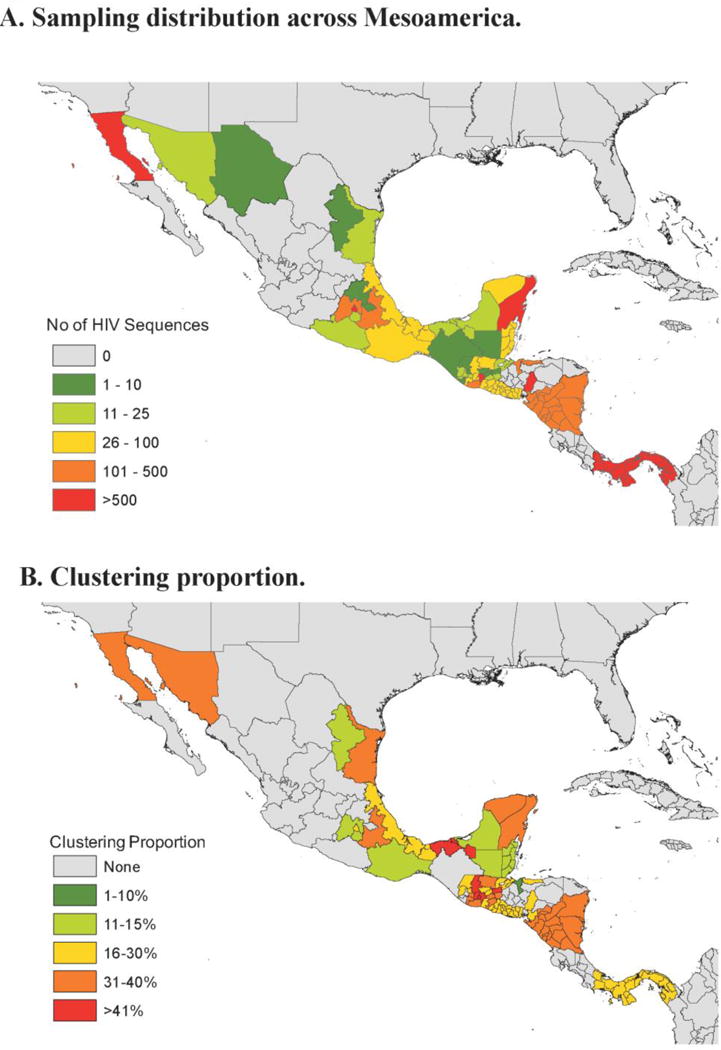
1A. Sampling distribution across Mesoamerica. The number of HIV pol sequences included in the analysis are represented. 1B. Clustering Proportion. Heat map representing the proportion of sampled HIV infected individuals within each geographic subdivision clustering with at least one other individual. Data are presented at the Country level for El Salvador, Belize, Nicaragua and Panama at the state/province level for Guatemala, Honduras, and Mexico.