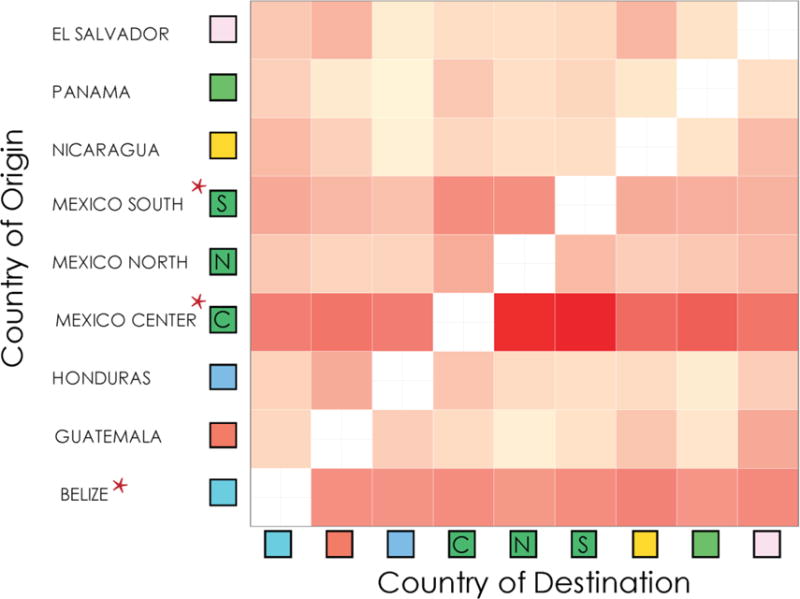
Figure 3. Matrix of HIV migration events.

An increase in redness represents a stronger migratory signal. Red asterisk indicates significant major sources of viral migration. Viral migration patterns were inferred using the Slatkin-Maddison approach on 100 iteration of random subsets of equal number of sequences per location (see Methods for details).
