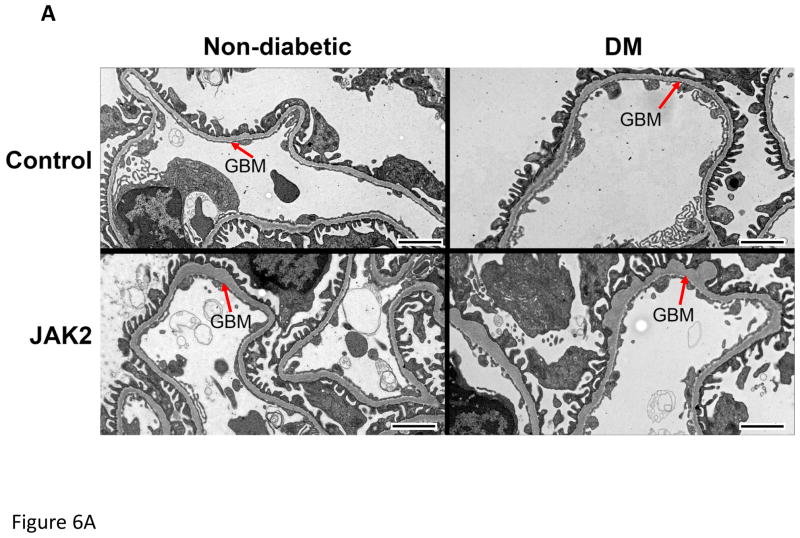
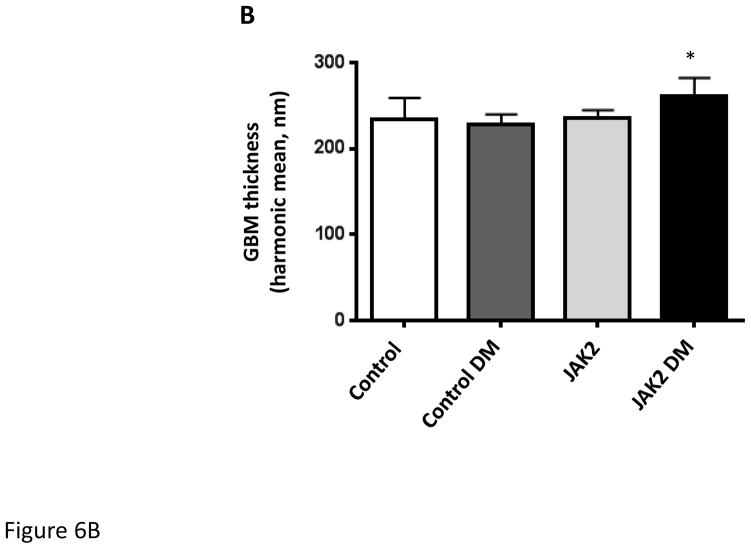
Figure 6.
Glomerular basement membrane (GBM) thickness. GBM thickness was assessed by transmission electron microscopy as shown in the electronmicrograph (A). GBM thickness was modestly but significantly increased (B) in JAK2 diabetic mice compared to the other groups. N = 5 for all groups. *p < 0.05. Scale bars are 2 μm in length.


