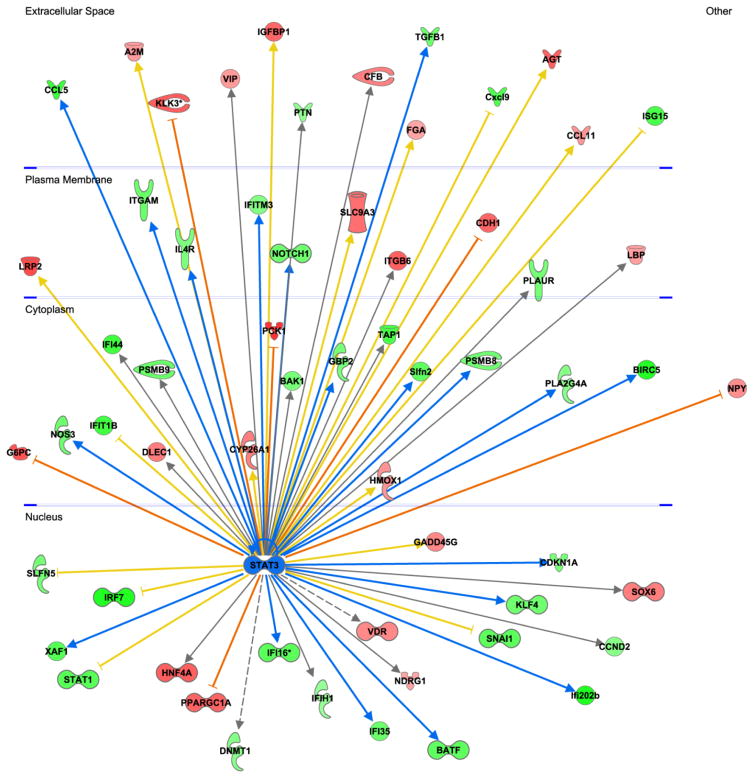
Figure 9.
Glomerular transcriptomic responses to JAK1/JAK2 inhibitor treatment in JAK2 diabetic mice. Analysis of glomerular RNA microarray data revealed that treatment with the inhibitor resulted in changes in expression of multiple genes including those responsive to STAT3 (central node, shown in blue). STAT3-dependent genes are depicted on the periphery of the diagram and are displayed in the cellular compartment (nucleus, cytoplasm, plasma membrane, extracellular space) where their gene products would be expressed. Genes that were upregulated by treatment with the inhibitor are shown in red and downregulated genes are shown in green. The intensity of the color connotes the relative degree of expression change. Since JAK-STAT3 signaling was expected to be suppressed by treatment with the JAK1/2 inhibitor, genes that were upregulated by STAT3 were predicted to be downregulated by the inhibitor (green nodes with blue arrows from STAT3). Conversely, genes that were downregulated by STAT3 were predicted to be upregulated by the inhibitor (red nodes and orange inhibition lines). Genes that were regulated in an opposite direction to that predicted based on known canonical signaling pathways (e.g., were predicted to be decreased by JAK1/2 inhibition but were actually increased) are connected to STAT3 by a yellow arrow or line. Those genes for which there was no prediction based on prior knowledge are connected to STAT3 by a gray arrow.

