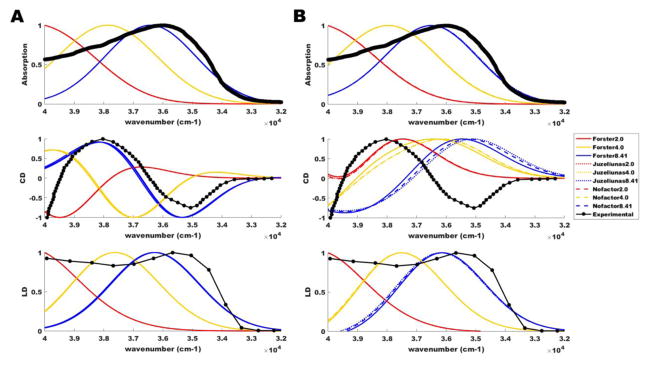
Figure 4.
Alignment of calculated spectra with experiment. Experimental spectra (black) and calculated spectra (red, yellow, blue) derived from applied Gaussian broadening of bare stick spectra at 3500 cm−1 full-width half maximum for absorption, circular dichroism (CD), and linear dichroism (LD) of tubulin at 300 K. Calculated spectra are shown for (A) tryptophan-only and (B) tryptophan and tyrosine aromatic lattices. All spectra are plotted in scaled units similar to the Vulto et al. treatment [150].

