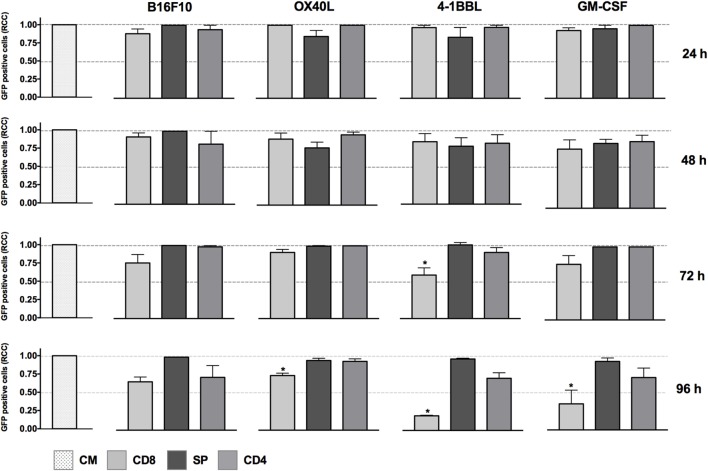
Figure 1.
In vitro assay to evaluate cytotoxicity induced by cell lines harboring single immunomodulators. Graphs represent GFP-positive cells that were counted using a high-content imaging system. We tested tumor-derived cell lines that harbored single immunomodulators. The immunomodulators are indicated above the graphs. Immunomodulatory B16-GFP cells were cocultivated as shown below each graph. CM, complete medium; CD4, primed CD4 T cells; CD8, primed CD8 T cells; SP, non-primed splenocytes; RCCs: relative cell counts normalized to the counts in the CM control. Graphs of mean and SEM. ANOVA and Dunnett’s multiple comparisons against CM (*P ≤ 0.005). Results from three independent experiments performed in triplicates.

