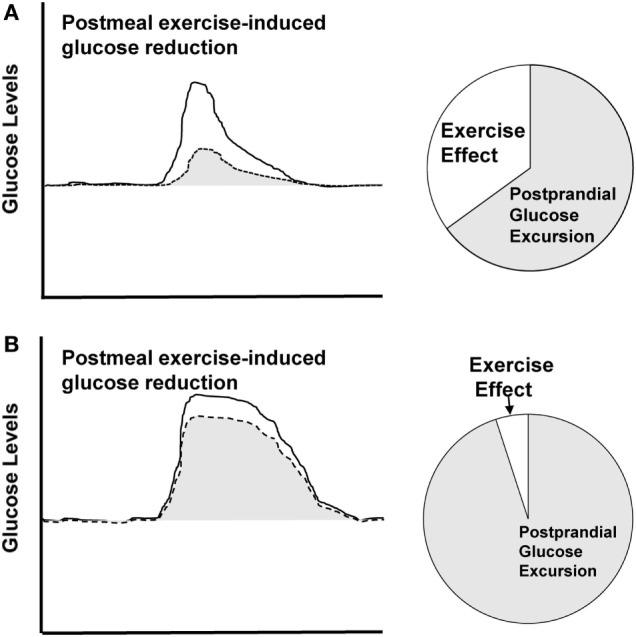
Figure 3.

Theoretical depiction. Solid line represents sedentary condition and dashed line represents postmeal exercise condition. (A) Displays larger effect size for postmeal exercise-induced glucose reduction in a smaller, shorter excursion. (B) Displays smaller effect size for a higher, longer glucose excursion.
