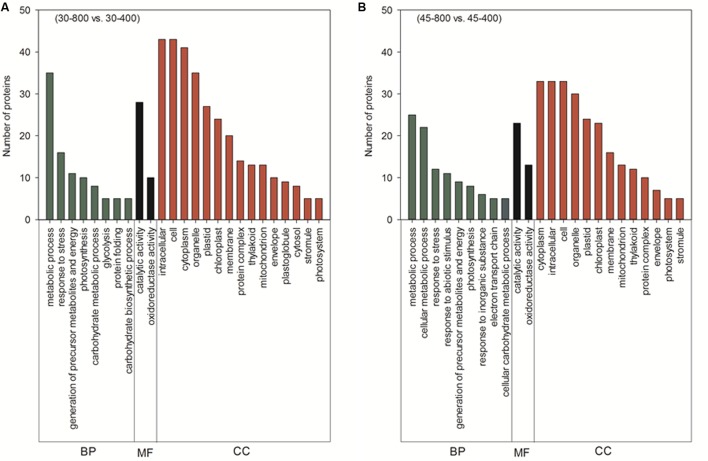
FIGURE 11.
Cluster analysis from gene ontology (GO) analysis of differentially expressed proteins in response to different CO2 concentrations under normal temperature (A) and heat stress (B) in leaves of bermudagrass. The treatments symbols are 30 and 45 for normal temperature control and heat stress and 400 and 800 for ambient CO2 and elevated CO2 concentrations, respectively. BP, biological process; MF, molecular function; CC, cellular component.

