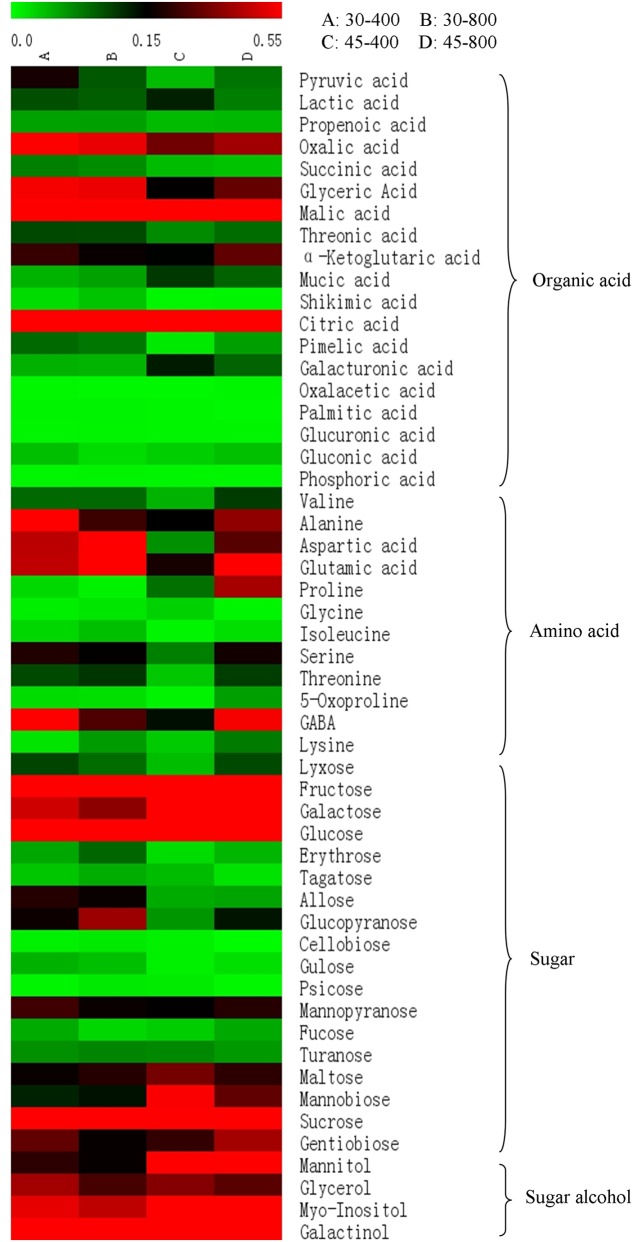
FIGURE 2.
Heat map analysis of total 53 differentially expressed metabolites in response to different temperatures and CO2 concentrations. The treatments symbols are 30 and 45 for normal temperature control and heat stress and 400 and 800 for ambient CO2 and elevated CO2 concentrations, respectively.

