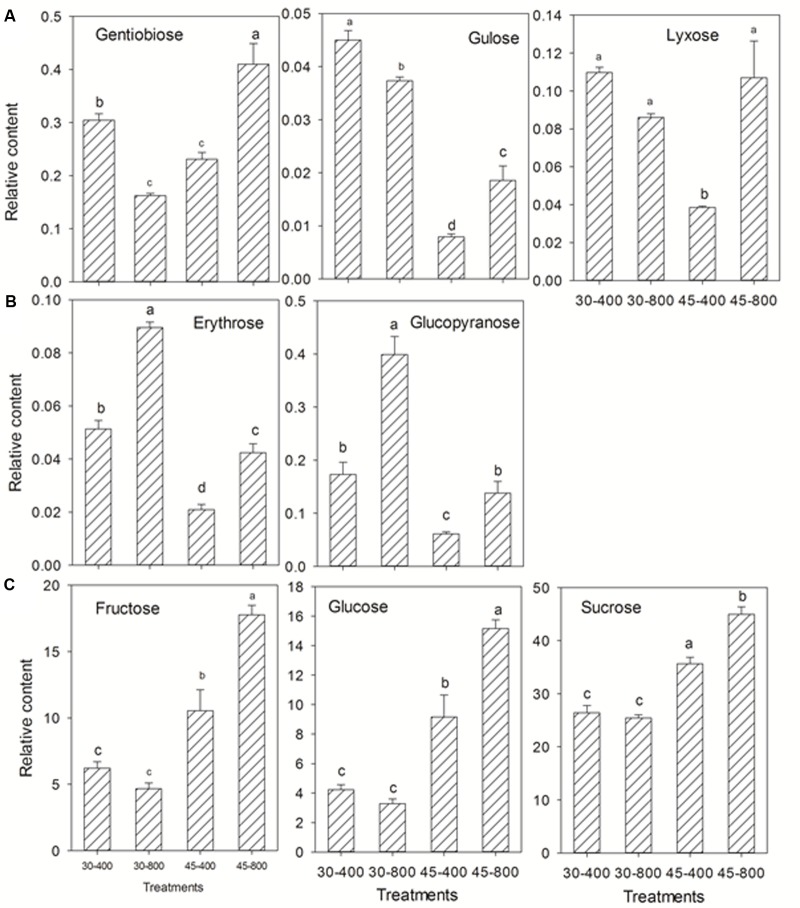
FIGURE 6.
Effects of elevated CO2 concentration on sugars in response to heat stress in bermudagrass. The treatments symbols are 30 and 45 for normal temperature control and heat stress and 400 and 800 for ambient CO2 and elevated CO2 concentrations, respectively. (A) Down-regulation or no changes under 30–800 and down-regulation under 45–800; (B) Up-regulation under both 30–800 and 45–800; (C) No changes under 30–800 and up-regulation under 45–800. Columns marked with different letters presented the significant differences based on LSD values (P ≤ 0.05) among treatments.

