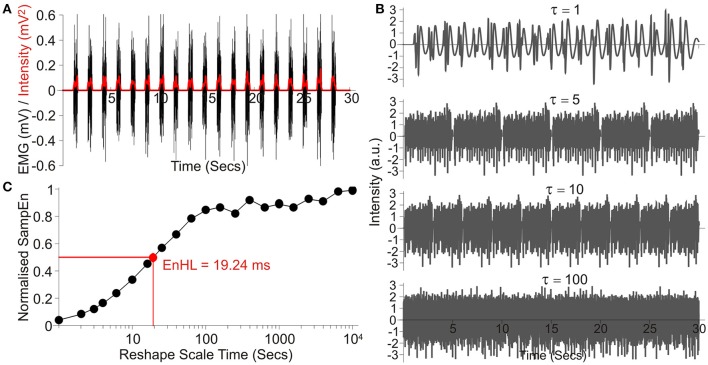
Figure 1.
Overview of processing steps, using an example signal taken from those simulated showing: (A) the raw signal (Black) and the intensity envelope (Red, It) resulting from its wavelet transformation; (B) a series of four signals created by resampling the standardized and filtered intensity envelope at increasing time steps, denoted by τ; (C) SampEn values resulting from analysis across the entire τ range, normalized to SampEn from the signal after random permutation of all data points. The resulting EnHL (Normalized SampEn = 0.5) is highlighted (Red point).

