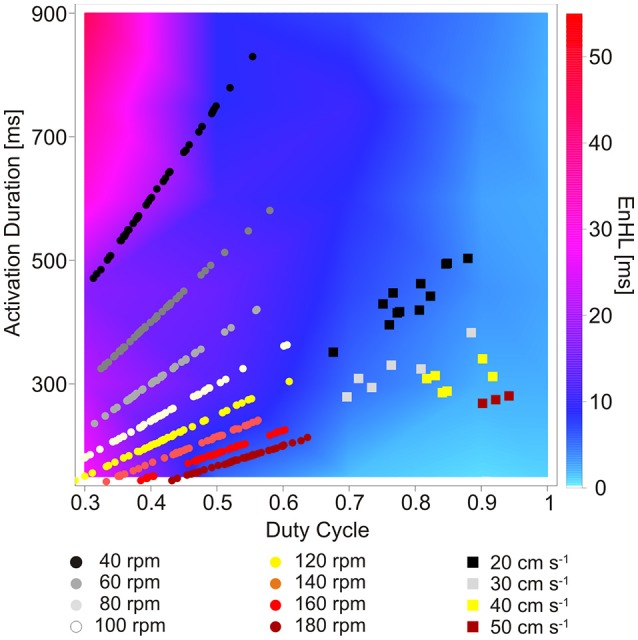
Figure 5.

Map of EnHLs as a function of activation duration and duty cycle. Warmer colors represent longer EnHLs. Overlaid data points represent activation durations and duty cycles reported for lower limb muscles of humans cycling (Blake and Wakeling, 2015) (circles) and rats running on a motorized treadmill (Hodson-Tole and Wakeling, 2008a, 2010) (squares). Black-gray tones represent faster cadence/velocity; yellow-red tones represent slower cadence/velocity.
