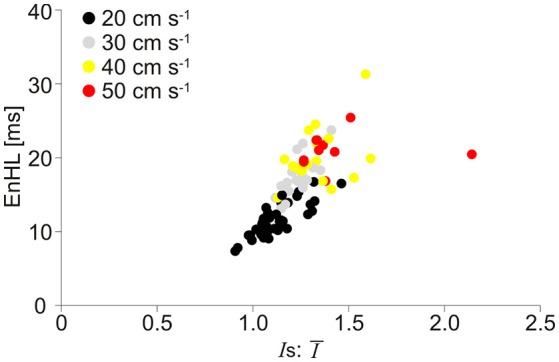
Figure 7.

Scatter plot of EnHL as a function of Is:Ī from the physiological myoelectric data recorded at different locomotor velocities. Is:Ī are taken from each of the three signal components assessed, and each point represents median values for the condition from one participant. Data are pooled across muscle, incline, and intensity component.
