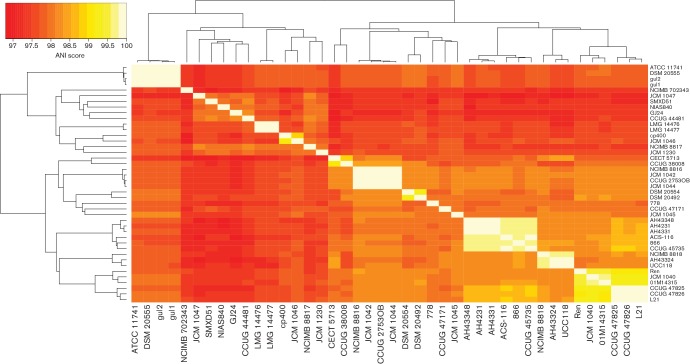
Fig. 3.
Clustering of pair-wise average nucleotide identity (ANI) scores agrees largely with the clustering of the core-gene tree in Fig. 2. The colour key (top-left) shows a gradation of colour from red to orange to yellow to white representing increasing genome-genome similarity. Euclidean distance and complete-linkage clustering were used to cluster rows and columns. L. hayakitensis DSM18933T is excluded.

