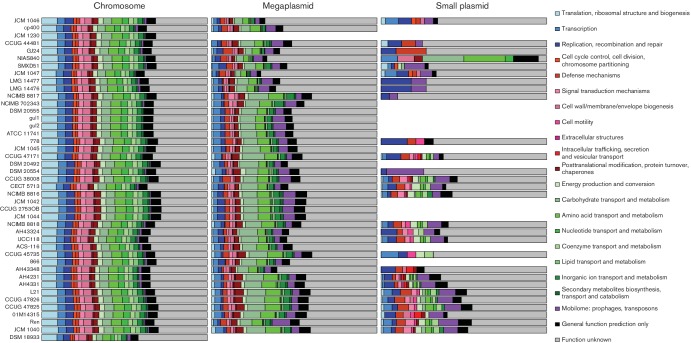
Fig. 4.
The proportion of genes assigned to each major COG category shows considerable variation across strains and plasmids. Colours and order of COG categories in each bar from left to right match the colour legend from top to bottom. The order of the strains (bars) reflects the order of the core-gene tree in Fig. 2. Genes are separated into chromosomal, megaplasmid and plasmid genes. In cases where genomes have multiple plasmids or megaplasmids, the COG counts were combined. Note that genes assigned to the linear megaplasmids of AH43348, JCM 1046 and JCM 1047 are also included in the bar plots for megaplasmids. The absence of plasmids from a particular genome is represented by the absence of a bar for that category.

