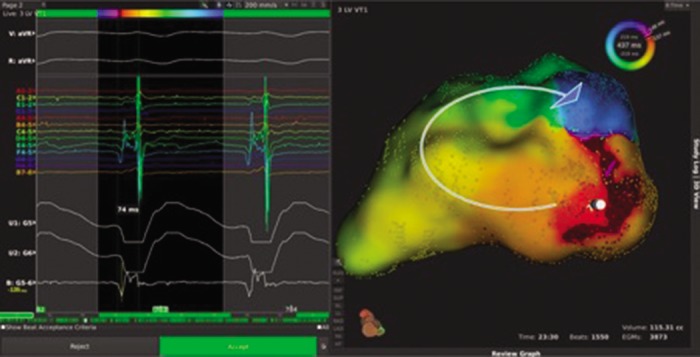
Figure 5: High-resolution Mapping of Sustained Monomorphic VT (right) and Electrograms from the Roving Catheter (left).

Area of earliest activation can be seen in red in the inferior basal region, with the wavefront path highlighted by the curved arrow. Entire cycle length is localised to a single pivot point, suggestive of discrete local re-entry with an adjacent site of early activation; this would need to be fully confirmed with additional point collection and entrainment at the pivot site. Used with permission from Boston Scientific. VT = ventricular tachycardia.
