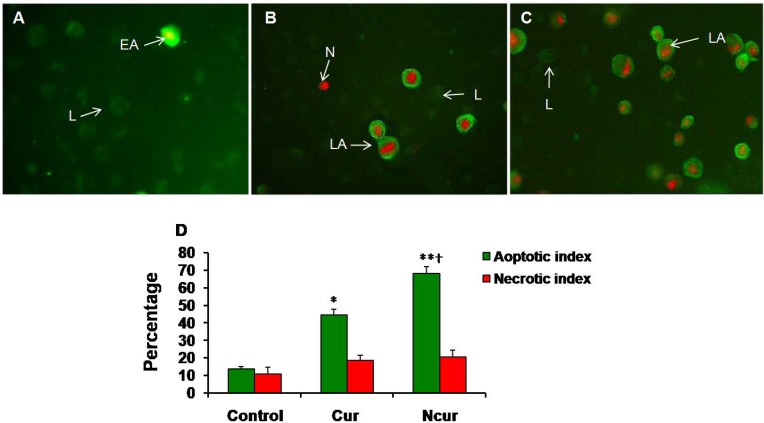
Figure 7.
Immunoflorecent microscopy of Annexin/PI staining in control and experimental groups (Magnifications: × 250). (A) Control group; (B) Cur group; (C) NCur group. EA: early apoptosis (Cell membrane is strongly stained with FITC), LA: late apoptosis (Cell membrane is strongly stained with FITC and Nucleus is stained by PI), N: Necrosis (Nucleus have red stain), L: Live (Cells have slightly green stain). (D) Apoptotic and necrotic indexes of control and experimental groups. Values are expressed as mean ± SD. *p < 0.01, **p < 0.001, †p < 0.01; * and † symbols respectively indicate comparison to control and Cur groups

