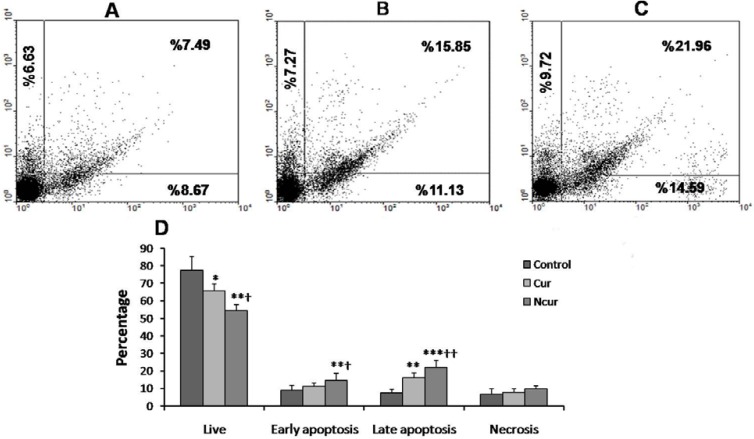
Figure 8.
Flow cytometry of Annexin/PI staining in control and experimental groups. (A) control group, (B) Cur group, (C) NCur group. The lower left quadrant (Annexin V-FITC-/PI−) was considered as live cells. The lower right quadrant (Annexin V-FITC+/PI−) was considered as early-stage apoptotic cells, the upper right quadrant (Annexin V-FITC+/PI+) was considered late-stage apoptotic cells, and the upper left quadrant (Annexin V-FITC−/PI+) was considered as necrotic cells. (D) Summaries of changes in the percentage of viable cells, necrotic and apoptotic cells. All assays were performed in triplicate, and the mean ± standard deviations are shown. *p < 0.05, **p < 0.01, ***p < 0.001, †p < 0.01, ††p < 0.001; * and † symbols respectively indicate comparison to control and Cur groups

