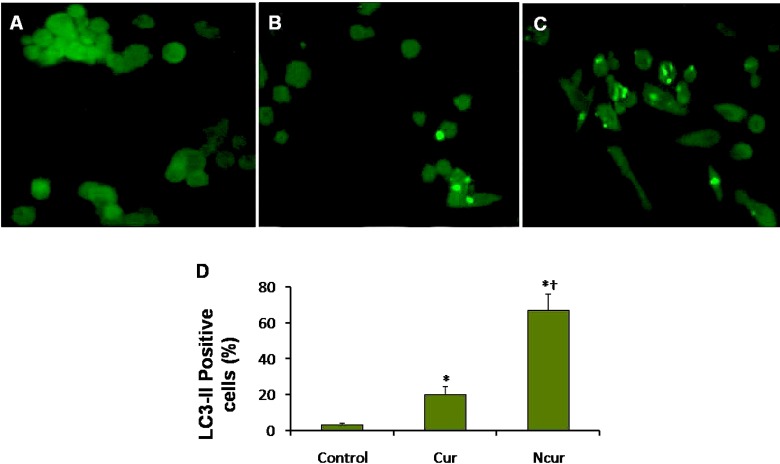
Figure 9.
Immunoflorecent microscopy of PC3 cells staining in control and experimental groups. Autophagosomes have light green staining. (A) Control group, (B) Cur group, (C) NCur group. Magnifications: ×400. (D) percentage of LC3-II positive cells. All assays were performed in triplicate, and the mean ± standard deviations are shown. *p < 0.001, †p < 0.001; * and † symbols respectively indicate comparison to control and Cur groups

