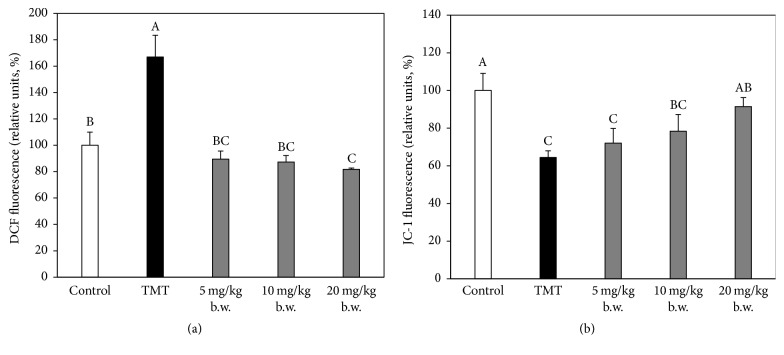
Figure 6.
Effect of AAFM on mitochondrial function of brain tissue in TMT injected mice. ROS production (a) and mitochondria membrane potential (MMP) (b). Data shown represent means ± SD (n = 5). The different capital letters from “A” represent statistical difference (p < 0.05) of each group in a high order.

