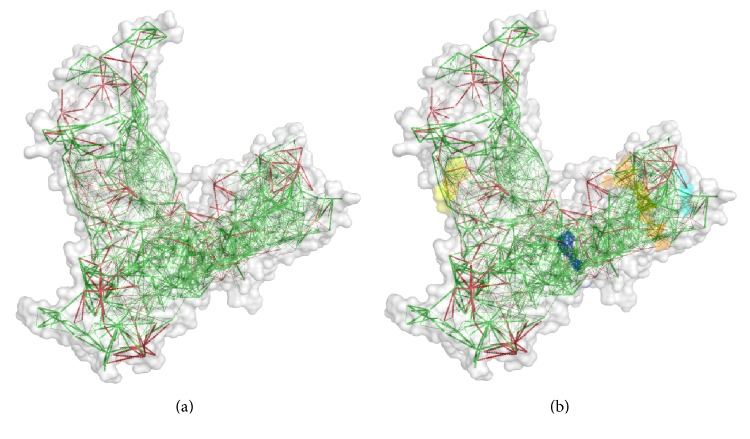
Figure 5.
The configurational frustration index of the predicted model of the SigA. (a) This analysis detects the stability and energy differences of the 3D structure of the protein. Colours are in accordance with their frustration index. The red colour regions are highly frustrated and the green colour regions are not frustrated. The frustrated residues are able to change their identity and also displace the location in any favourable conditions. (b) The locations of our proposed epitopes are described by different colours. The epitopes HTTWTLTGY (cyan) and IELAGTLTL (blue) are well outside of the frustrated regions and securing their stability. On the other hand, the epitopes VTARAGLGY (yellow) and FHTVTVNTL (orange) are in the frustrated regions and unable to secure their stability.

