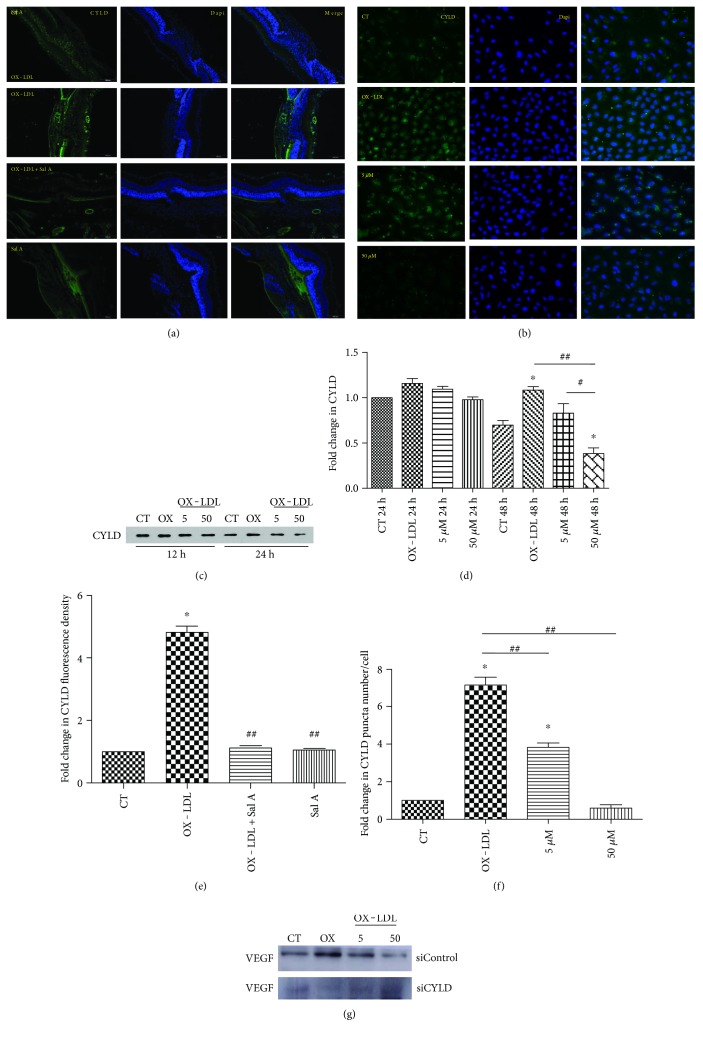
Figure 8.
CYLD involves in OX-LDL-induced angiogenic process. C57 mice and ARPE-19 cells were treated as before. (a) Representative immunofluorescence images of CYLD in RPE/choroid of animal 7 days after laser. (b) Representative immunocytochemistry images of CYLD in ARPE-19 cells 48 hours after treatment with SFM, OX-LDL (100 mg/L), and OX-LDL (100 mg/L) + Sal A (50 μM). (c, d) Western blot result of ARPE-19 cells showing that CYLD was increased in the OX-LDL group compared with the control and decreased in the OX-LDL + Sal A group compared with the OX-LDL group. (e, f) Quantitative fluorescence density results showing that CYLD fluorescence was prominent in CNV focus and higher density was found in the OX-LDL group than the control and OX-LDL + Sal A groups. (g) ARPE-19 cells were transfected with CYLD siRNA or siControl and then cultured as before for 24 hours. Western blot results showing that CYLD knockdown inhibited OX-LDL VEGF secretion. Data are expressed as the mean ± SEM (n = 10 eyes/group; n = 40 cells/group). ∗P < 0.05 versus the control group. #P < .05 versus OX-LDL + Sal A (5 μM) group after 48 hours. ##P < 0.05 versus the OX-LDL group.

