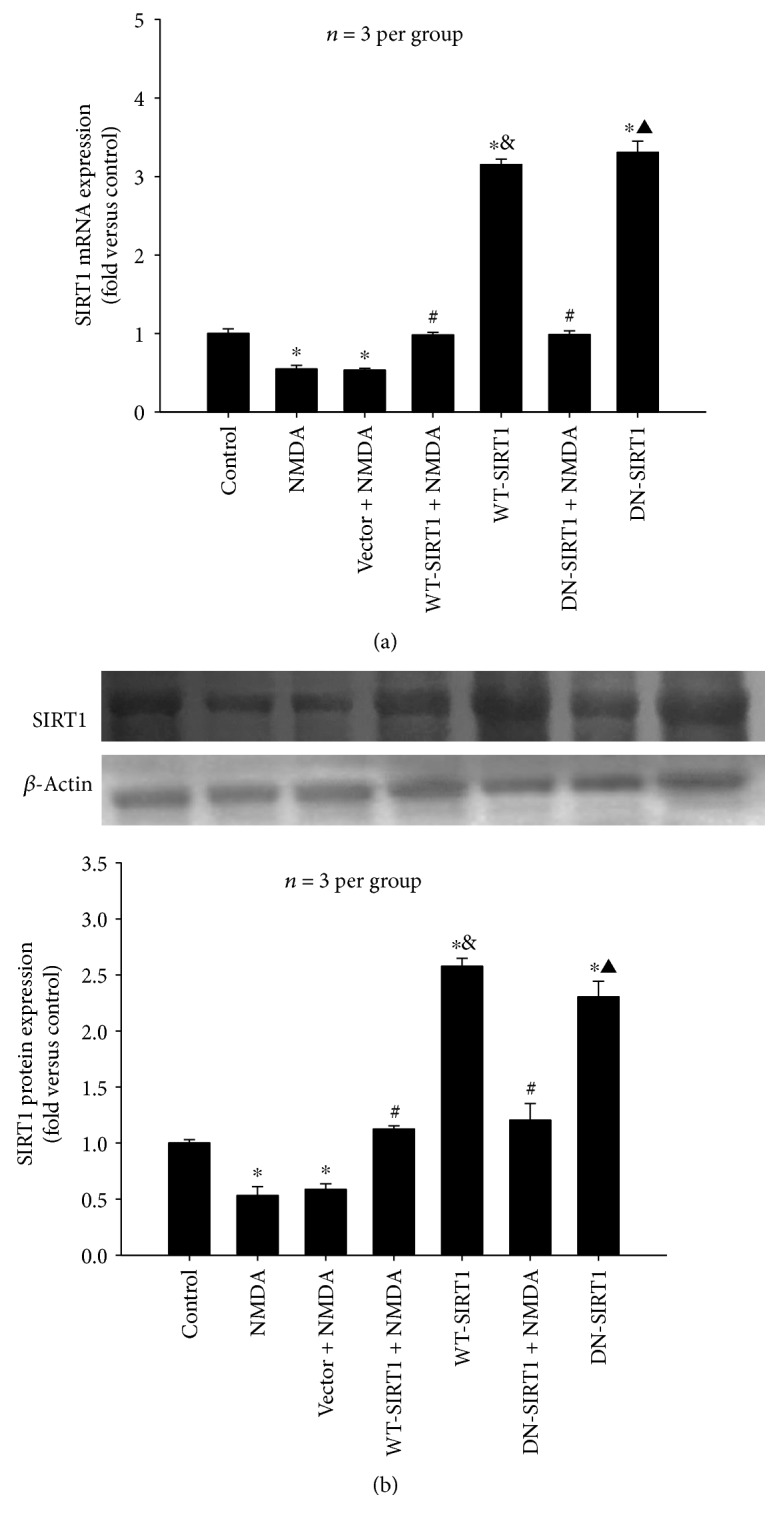
Figure 6.

Overexpression of SIRT1 (WT-SIRT1 or DN-SIRT1) increased the levels of SIRT1 mRNA and protein reduced by NMDA (500 μM) in SH-SY5Y cell (P < 0.05). (a) Quantitative representations of SIRT1 mRNA by bar graph. (b) Western blot probed with antibodies against SIRT1 and β-actin (upper panel) and quantitative representations of SIRT1 protein expression by bar graph (lower panel). Each value represents the mean ± S.E.M. of three independent experiments. ∗P < 0.05 versus the control group. #P < 0.05 versus the vector + NMDA group, &P < 0.05 versus the WT-SIRT1 + NMDA group, ▲P < 0.05 versus the DN-SIRT1 + NMDA group.
