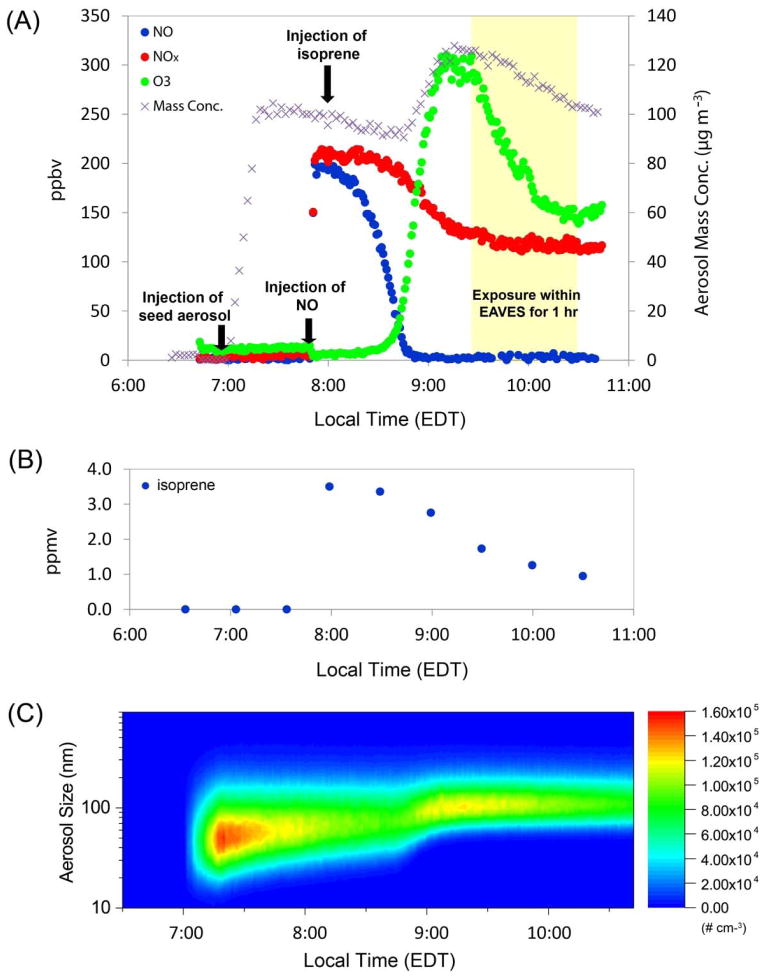
Figure 1.
Experimental profile of the photochemical oxidation experiment of isoprene. (A) Measurements of NO, NOx, O3 and aerosol mass concentration during the time course of experiment; (B) Decay of isoprene; (C) Shift of aerosol size distribution to greater values following the photochemical oxidation of isoprene, consistent with condensational SOA growth.

