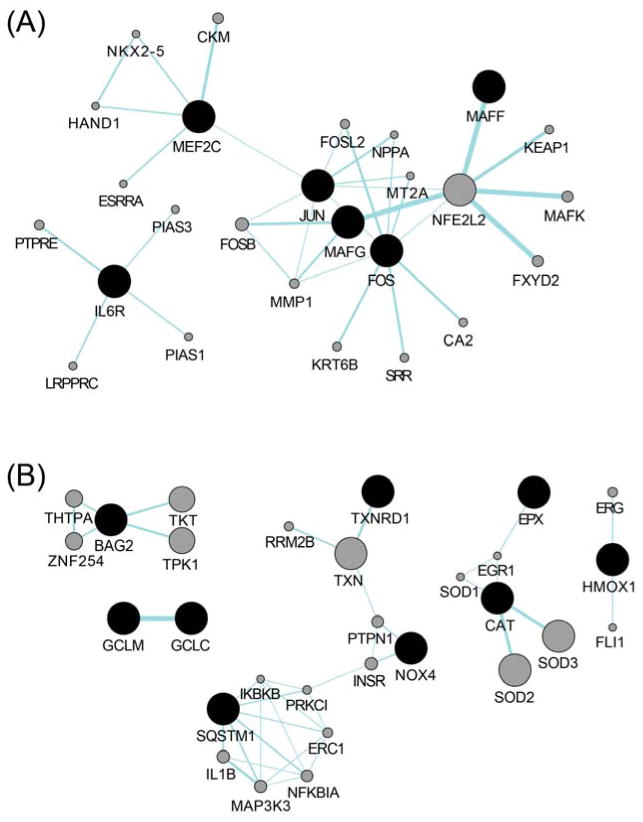
Figure 4.
Networks of gene-gene functional interactions for differentially expressed genes (FDR<0.3) derived from (A) NanoString human inflammation platform, and (B) human oxidative stress plus RT2 Profiler. Black nodes represent the input genes which were significantly altered upon isoprene SOA exposure, and gray nodes represent predicted related genes. Links denote associated pathways. The interactive gene network construction was performed and visualized using the GeneMANIA Cytoscape app.

