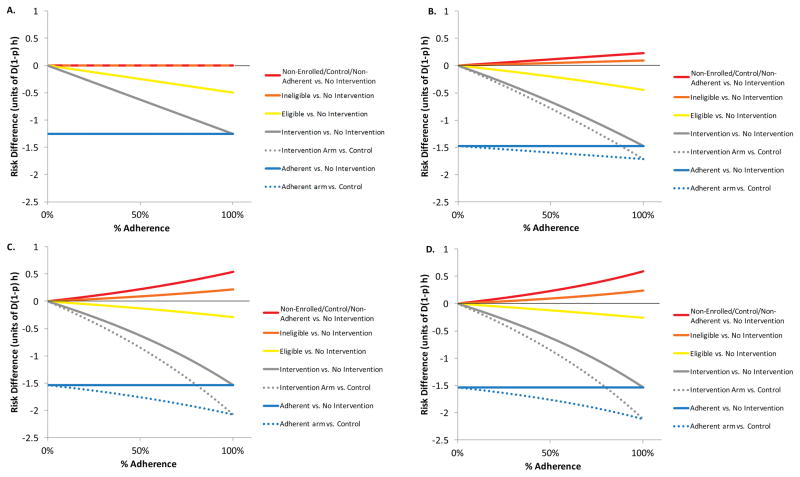
Figure 2.
A–D: Risk difference between groups in the eligible trial population when 80% of the 16 year old female population is eligible and enrolled, 50% is in the intervention group, the relative desirability of ineligible females, q, is 40%, and adherence is varied from 0–100% for values for the maximum number of rejections before a male stops trying to partner, w: 2A. Risk difference without displacement (w=1); 2B. Risk difference with displacement (w=2); 2C. Risk difference with displacement (w=5); and 2D. Risk difference with displacement (w=500). The solid curves show the risk difference for each of several groups relative to the counterfactual scenario of no intervention while the dashed lines show the measured risk differences for the intervention group and the adherent group, relative to controls.

