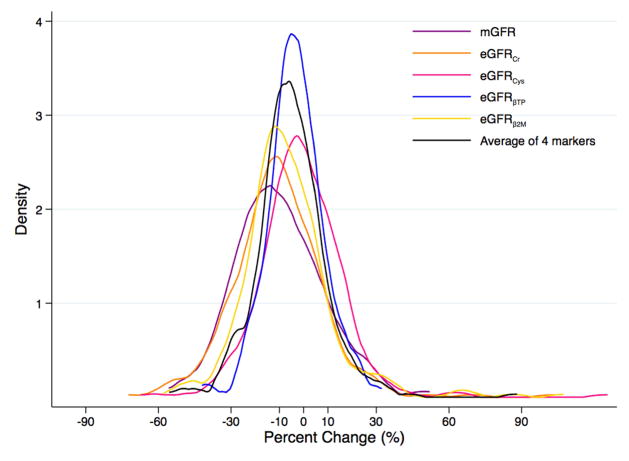
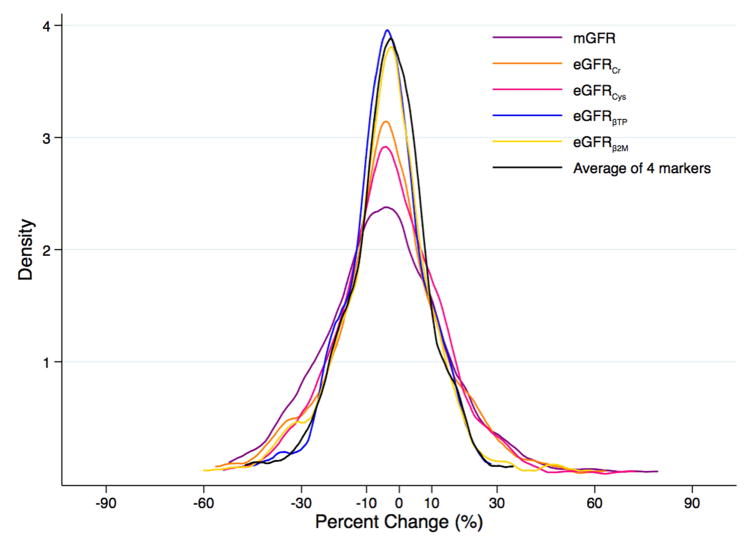
Figure 2.
Kernel Density Plot of Change in Measured and Estimated Glomerular Filtration Ratea,b (A) in the Modification of Diet in Renal Disease Study and (B) in the African American Study of Kidney Disease and Hypertension
amGFR in purple; eGFRcr in orange; eGFRcys in pink; eGFRBTP in blue; eGFRB2M in yellow; average of four filtration markers in black
bMean (standard deviation) percent change over one year in the MDRD Study and AASK, respectively, was −10.0% (18.2%) and −4.2% (18.8%) for mGFR, −10.5% (19.0%) and −3.2% (16.9%) for eGFRcr, −1.0% (17.5%) and −2.6% (16.1%) for eGFRcys, −3.3% (11.6%) and −2.5% (22.5%) for eGFRBTP, −6.6% (18.9%) and −3.8% (14.7%) for eGFRB2M, and −5.4% (14.6%) and −3.0% (13.0%) for the average of the four filtration markers.


