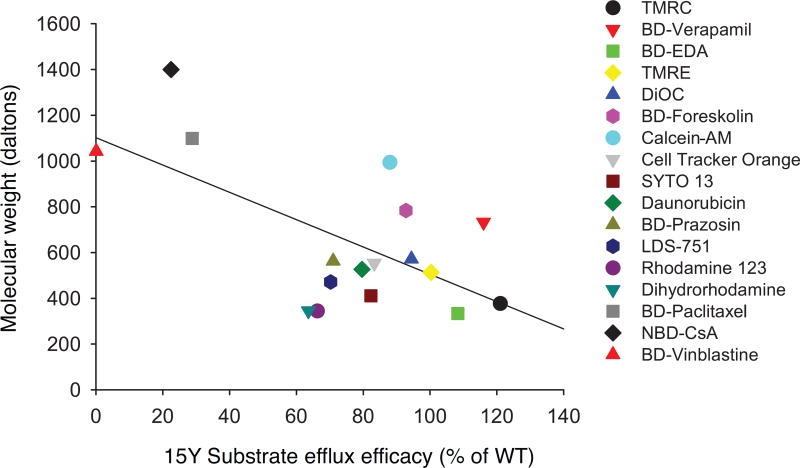
Fig. 8. Negative correlation between size of substrates and their transport by 15Y mutant P-gp.
Physico-chemical characterization of tested substrates revealed a negative correlation between molecular size and transport level of each substrate by 15Y mutant P-gp. The X axis of plot is the transport level (Fig. 2 and Table 2) and the Y axis is the molecular weight of the substrates. Correlation coefficient value is −0.56. Each shape represents one fluorescent substrate (list given on the right).

