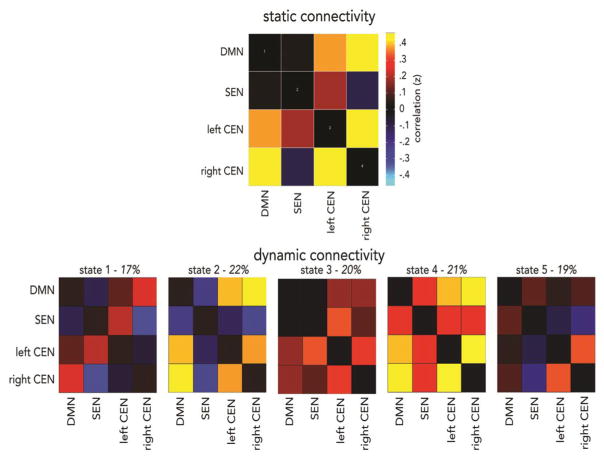
Figure 2. Static (top) and dynamic (bottom) functional neural connectivity across the entire youth sample.
Conventional static connectivity is shown as the correlation between core neurocognitive network components, averaged across the entire resting-state scan. Using sliding windows analysis and k-means clustering, five dynamic connectivity states were identified that reoccur across the scan and over all participants. Percentage of occurrence is listed for each state, over the course of the scan. Abbreviations: default mode network, DMN; salience and emotion network, SEN; central executive network, CEN.

